In Treasury Strategies’ recent corporate bank fee management survey, 70% of corporate treasurers said they review their bank service fees on a monthly basis. Yet only 21% use service price benchmarks in their bank fee management program. That’s a huge disconnect.
There is value in your account analysis statements. U.S. treasury managers spend nearly $20 billion per year on transaction banking services. Clearly, configuring those treasury management services properly and negotiating a fair price can save a lot of money. Using the right service fee benchmarks and using them properly is essential. This is a bit tricky and we see in our treasury consulting many analyses that are superficial, leading companies to fight with their banks over “fee violations” when the problems lie elsewhere. Chasing pennies on bank services billing statements burns both energy and goodwill and can ultimately impair bank credit relationships.
Lockbox Fees. A common example is a corporate cash manager comparing a $0.40 lockbox item processing fee at Bank A with a $0.60 per item fee at Bank B and concluding Bank B is 50% more expensive. Furthermore, the company is only directing 400 items per month through Bank A’s lockbox, but 4,000 through Bank B. Seeing this, many go off and challenge their banks on the lockbox service fees. Some go so far as to issue an RFP and put the services out to bid. While sometimes beneficial, that process does have the potential to waste a lot of time and money.
Clients of NDepth, our bank fee analysis solution, understand this dilemma.
They see clearly each month that the true cost of treasury management services has two dimensions:
- The bundle of services used, which we call “product families”, and
- The number of transactions, since most treasury services are scale driven.
To be truly useful, transaction banking fee benchmarks must reflect both dimensions.
Continuing the lockbox example, NDepth rolls up all relevant line item fees into an overall lockbox product family. Some corporate treasury professionals use AFP service codes (published by the Association for Financial Professionals) for the roll-up. Others rely on NDepth’s market driven bank service mapping. Either way, the remittance processing service bundle could include monthly lockbox maintenance, daily deposit ticket charges, fees for photocopies and/or images, electronic data transmission, courier packages, encoding charges and so on. Some of these are fixed monthly charges, some are per-day charges, and others are item or transaction based. When factored together, it’s possible that the “cheaper” Bank A lockbox is $4.00 per item while the “expensive” Bank B is only $3.00 per item. Simply comparing the $0.40 to $0.60, as many bank fee management software solutions do, leads to a wrong answer.
Next, NDepth considers volumes at the product family level to assess scale. Some of the lockbox costs described above are fixed. Others vary by volume. It may well be that Bank A’s all-in $4.00 price is so high because the volume is low. Or it just may be the bank’s price is high.
The point is this: without volume-scaled, product family-level benchmarks, you can’t know!
Now imagine that you have access to the NDepth benchmarks for lockbox. You might see that at your Bank A volume of 400 items per month, the median benchmark price is $5.00. Wow. At $4.00, Bank A’s price is actually very good. (See Figure 1).
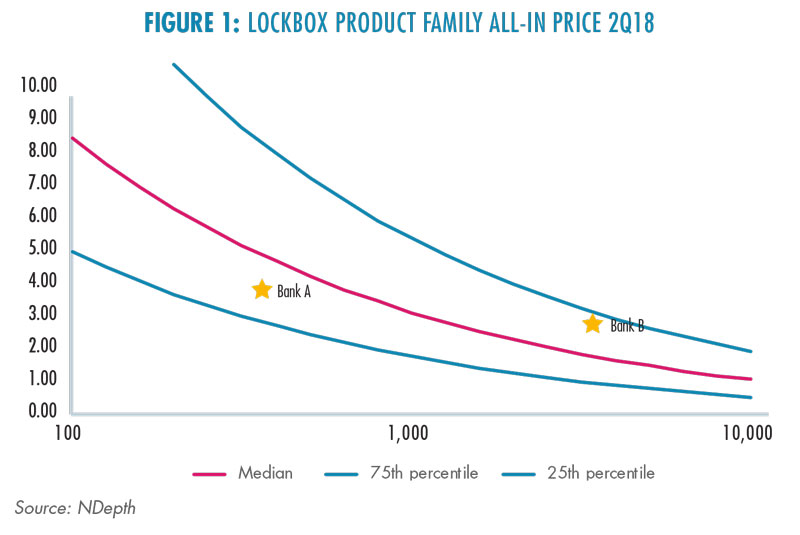
Conversely, for the 4,000 items per month at Bank B, the NDepth benchmark median is $2.00. This is a powerful signal that at your current cost of $3.00, either your services aren’t configured properly, or your pricing is off. Either way, you have some investigating to do. Perhaps your all-in price is too high because you use unnecessary or redundant services, such as check images as well as photocopies. Or express mail remittance packages as well as electronic data transmission. Or multiple daily deposits rather than deposits only at key cutoff times. Maybe you’re using Fedwire to consolidate your deposit balances rather than ACH cash concentration services. These are easy fixes made possible because of the proper benchmarks.
Notice also that both Bank A and Bank B lockbox product family prices fall between the 25th and 75th percentile banks (blue lines). For many corporate treasurers, that provides sufficient comfort and there would be no need for action.
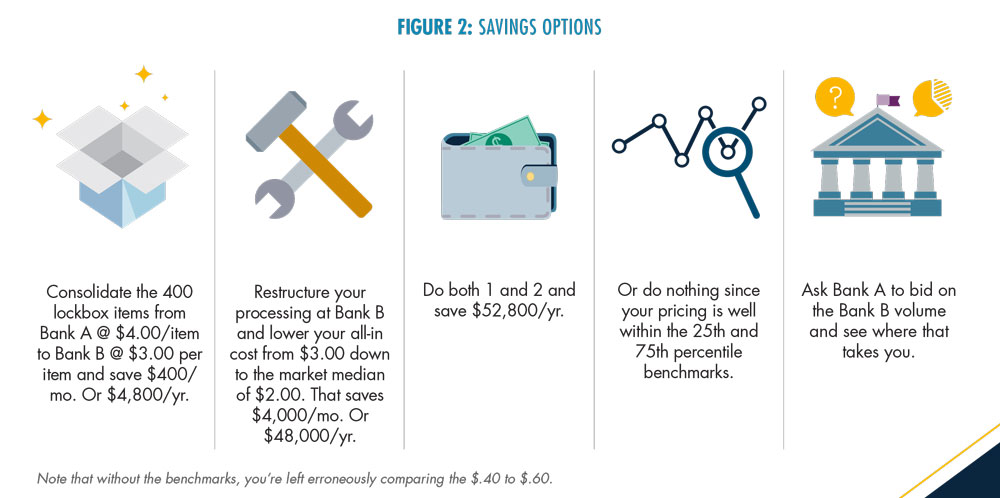
So, from this one NDepth price benchmark chart for just a single product family, you can build out a robust set of savings options. (See Figure 2).
Wire Transfer Fees. Now consider the following example for wire transfers. This is where bank service price benchmarks are extremely valuable. Wire prices across this company’s four banks range from $13 to $21. If the company cash manager were simply self-benchmarking, the conclusion might be to move all wires to Bank B to take advantage of the $13 price, the lowest in that company’s bank group. While that would result in benefit, it misses the key opportunities. (See Figure 3).
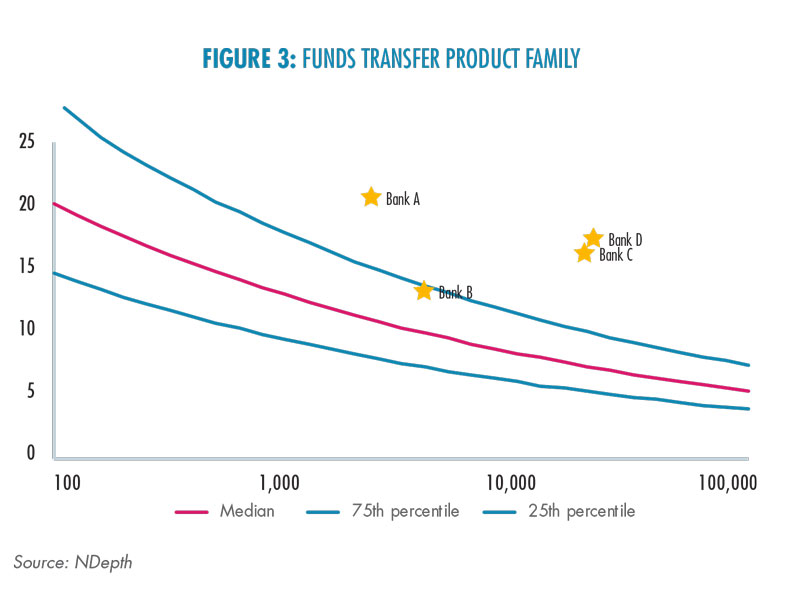
Thanks to NDepth benchmarks, we see that at ALL four banks, pricing is above the 75th percentile. That should set off alarm bells. Perhaps the company is executing transfers manually rather than using a bank portal. Perhaps optimizing across Fedwire, SWIFT or CHIPS could reduce fees. Perhaps regional offices are getting telephone notification of incoming wires rather than electronic messages. Perhaps there could be savings by consolidating at just one or two banks. Maybe same day ACH or other automated clearinghouse services could substitute. Emerging “Faster Payments” and “Real-Time Payments” initiatives might be the way to go. The list goes on.
In this example, the company executes about 2,500 wires per month at an average price of $17.00. If they consolidated and could achieve even the high end 75th percentile market price of $8.00/wire, they would save $9.00 on each of the 2,500 wires. On an annual basis, that is an incredible savings of $270,000/yr. that would not have been possible absent the NDepth benchmarks.
As we see in our treasury consulting, this same methodology applies to the full range and bank operating services. Deposit services, automated clearing house (ACH), EDI, balance reporting, value, disbursements, account reconciliation, sweep accounts and many other transaction processing and information services can all be managed better with benchmarks.
As mentioned in the introduction, although more than 70% of companies employ a monthly bank fee-management program, only 21% use external transaction bank price benchmarks. Even among that 21%, most use benchmarks at a line item level rather than a product family level. Finally, very few have access to the all-important volume scale dimension of price benchmarks. Both examples provided show the importance of that.
The good news is that tools and price benchmarks are now available to corporate treasurers for proper bank fee analysis.
Related Articles
Bank Fee Analysis, Ripe with Opportunity — New automated bank fee management solutions are providing state of the art tools and benchmarks. They even read PDF bank account analysis statements and avoid messy EDI 822 files. To save time and money, you can now just drag and drop.
Understanding Your Bank Fee Analyses — Bank Account Analysis statements are daunting. U.S. companies spend $20 billion per year on transaction banking services, yet the bank services billing statements are indecipherable.
Earnings Credit Rates Rise at Uneven Pace — Getting an allowance on your residual bank balances can be a nice source of income. Our NDepth earnings credit rate benchmarks show wide variances for the third quarter.
Making the Most of Your Bank Balances — Many corporate liquidity management programs overlook bank balances. This article explains the importance of ECR, compensating balances, bank sweep accounts and money market funds.
Corporate Treasury Priorities — Each year, Treasury Strategies assesses the state of the treasury profession and key issues on the horizon. Top priority for this year is cash forecasting, treasury systems and optimizing treasury technology. Top benchmarking need is bank service fees.
If you’d like to receive more information or a free custom report, please contact ndepth_info@treasurystrategies.com